Snapshot
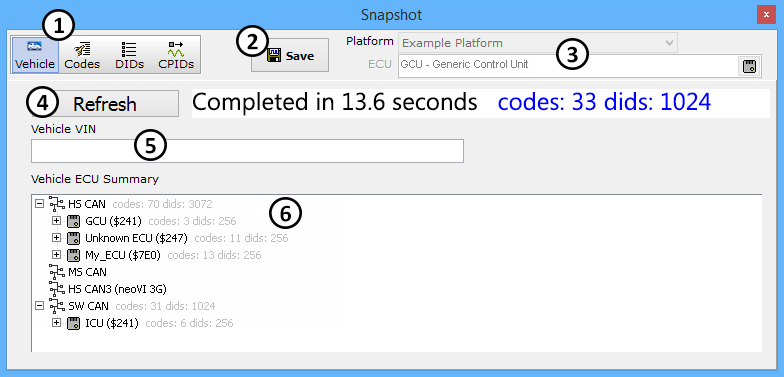
The Snapshot tool uses four different views (Figure 1: ![]() ) to perform many different tasks (three views for ISO 14229). A database platform and an ECU can be selected at location (Figure 1:
) to perform many different tasks (three views for ISO 14229). A database platform and an ECU can be selected at location (Figure 1: ![]() ). Use the Save button (Figure 1:
). Use the Save button (Figure 1: ![]() ) to open a dialog to save results to a file.
) to open a dialog to save results to a file.
 Vehicle / Bus Query View
The Vehicle / Bus Query view can read all fault codes and DIDs from ECUs across all networks with one mouse click! Just click the Refresh button (Figure 1: ![]() ) and sit back and let Vehicle Spy do all the work. The status line (Figure 1:
) and sit back and let Vehicle Spy do all the work. The status line (Figure 1: ![]() ) will keep you informed of the progress. Once completed, the Vehicle VIN will be decoded and displayed just below the status line. The Vehicle ECU Summary area (Figure 1:
) will keep you informed of the progress. Once completed, the Vehicle VIN will be decoded and displayed just below the status line. The Vehicle ECU Summary area (Figure 1: ![]() ) will show all of the collected data. The collected data is decoded using the database platform and DTC database. Click the +/- buttons in the tree to expand and contract the branches to see more or less detail.
) will show all of the collected data. The collected data is decoded using the database platform and DTC database. Click the +/- buttons in the tree to expand and contract the branches to see more or less detail.
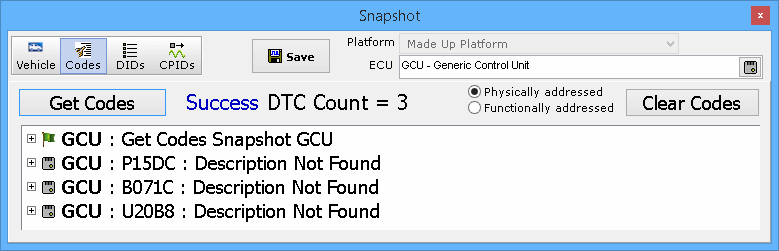
 Codes View
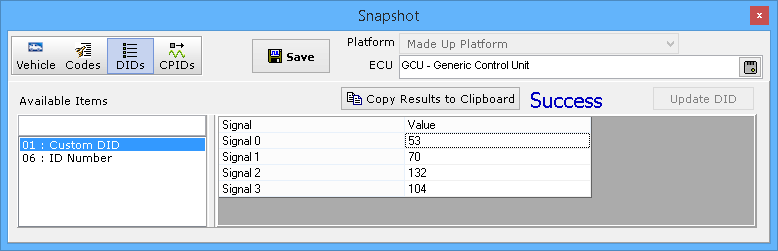
 DIDs (and
  CPIDs) View