
Collections and Methods: Histogram Method
Histogram Axis Configuration
Histogram Dimension Selection

Histogram Axis Expression and Options
Axis Tabs
Changing the dimension of the histogram will add or remove tabs from the list; (Figure 2:![]() ) shows the tabs for a 3 Dimensional histogram setup.
) shows the tabs for a 3 Dimensional histogram setup.
Expression Selection
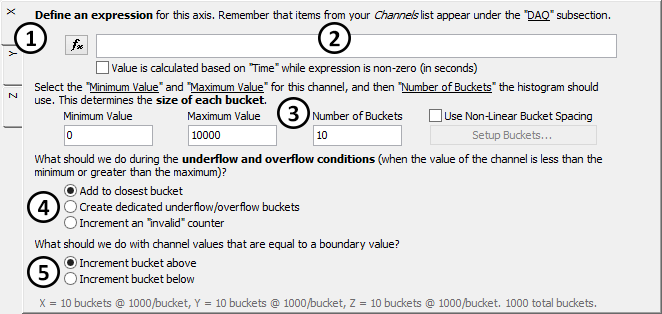
Press the ![]() button to define an expression for the current axis using the Expression Editor (Figure 2:
button to define an expression for the current axis using the Expression Editor (Figure 2:![]() ).
).
Minimum Value / Maximum Value / Number of Buckets
For example, the default settings shown in (Figure 2:![]() ) define a histogram where the lowest possible value is 0, the highest is 10,000 and the number of buckets is 10. This means that each bucket will have a size of 1,000. Remember that these values, which are summarized at the bottom of Figure 2, are set on a per-axis basis.
) define a histogram where the lowest possible value is 0, the highest is 10,000 and the number of buckets is 10. This means that each bucket will have a size of 1,000. Remember that these values, which are summarized at the bottom of Figure 2, are set on a per-axis basis.
Underflow and Overflow Handling
This selection determines how to handle values that fall outside the defined range: underflow (values below the defined Minimum Value parameter) and overflow (values above Maximum Value). The choices (Figure 2:![]() ) are as follows:
) are as follows:
Boundary Value Handling
This option specifies how to handle values that exactly equal a boundary between buckets (Figure 2:![]() ):
):
Sample Options
Sample Every # Seconds
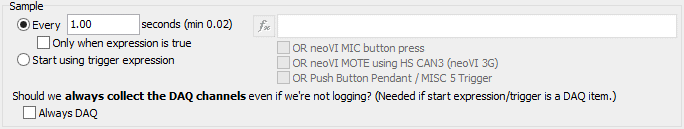
Checking the Only when expression is true box causes data to be logged periodically only when the specified expression is true. Press the ![]() button to select the expression; you can also check boxes to enable any of the following events as triggers for sampling:
button to select the expression; you can also check boxes to enable any of the following events as triggers for sampling:
Start Using Trigger Expression
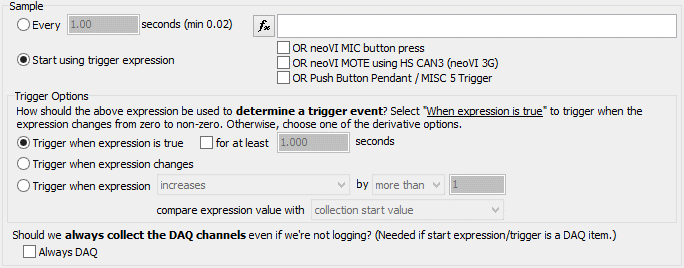
Selecting a Trigger
Press the ![]() button to select the expression, and optionally check boxes to enable any of the following events as triggers:
button to select the expression, and optionally check boxes to enable any of the following events as triggers: